FLIR Thermal Studio setup and user guide, This manual covers the FLIR Thermal Studio application from version 2.0.
FLIR Systems issues generic manuals that cover several software variants within a software suite. This means that this manual may contain descriptions and explanations that do not apply to your software variant.
The authoritative version of this publication is English. In the event of divergences due to translation errors, the English text has precedence. Any late changes are first implemented in English.
Our manuals are continuously updated and published online.
To access the FLIR Thermal Studio series user manual and other product documentation, go to https://support.flir.com/resources/5sfn/ .
To access the manuals for our other products, as well as manuals for our discontinued products, go to https://support.flir.com/resources/app .
FLIR Thermal Studio is a powerful, flexible, and efficient Windows desktop software for creating thermal inspection reports and automation of editing tasks with large amounts of thermal images. The software supports images and videos in standard FLIR format from all modern FLIR thermography cameras. With the Acoustic plug-in you can also create reports based on images and videos from the acoustic camera FLIR Si124.
FLIR Thermal Studio provides features where the user can:
Instead of manually creating an inspection report, design your own template and include the information you need for this particular report. Working with templates makes the work easier especially when you handle a large number of images.
Select what information you want to see in the image, for example measurements, emissivity, compass (when applicable), and date/time. Import palettes and apply colorization from other thermographers.
Respond to any alignment issues caused by thermal cameras.
Automate the tasks that need to be repeated for each thermal image such as normalization, modifying measurements, changing palettes, and customizing image overlay.
Create inspection routes you can download to an enabled FLIR camera. Import the inspection images and data and create a report.
2.1 FLIR Thermal Studio versions
The FLIR Thermal Studio desktop suite includes several versions and plug-ins.
For detailed specifications, go to https://flir.custhelp.com/app/answers/detail/a_id/4590 .
Read Also : ANNKE VISION General Guide of Watching Cameras
Installation
This chapter describes how to install and activate the FLIR Thermal Studio application.
3.1 System requirements
For system requirements, go to https://flir.custhelp.com/app/answers/detail/a_id/4590 .
3.2 Install application
Note To complete the installation, the computer may need to be restarted. Follow the instructions on the screen.
3.3 License activation
The first time you start FLIR Thermal Studio you will be prompted to activate your license key. Do this either as an Online activation (internet access) or as an Offline activation (no internet access).
3.3.1 Online activation
3.3.2 Offline activation
3.4 Plug-in activation
Plug-ins are supported by FLIR Thermal Studio Pro.
User interface
This chapter provides an overview of the FLIR Thermal Studio user interface.
4.1 General

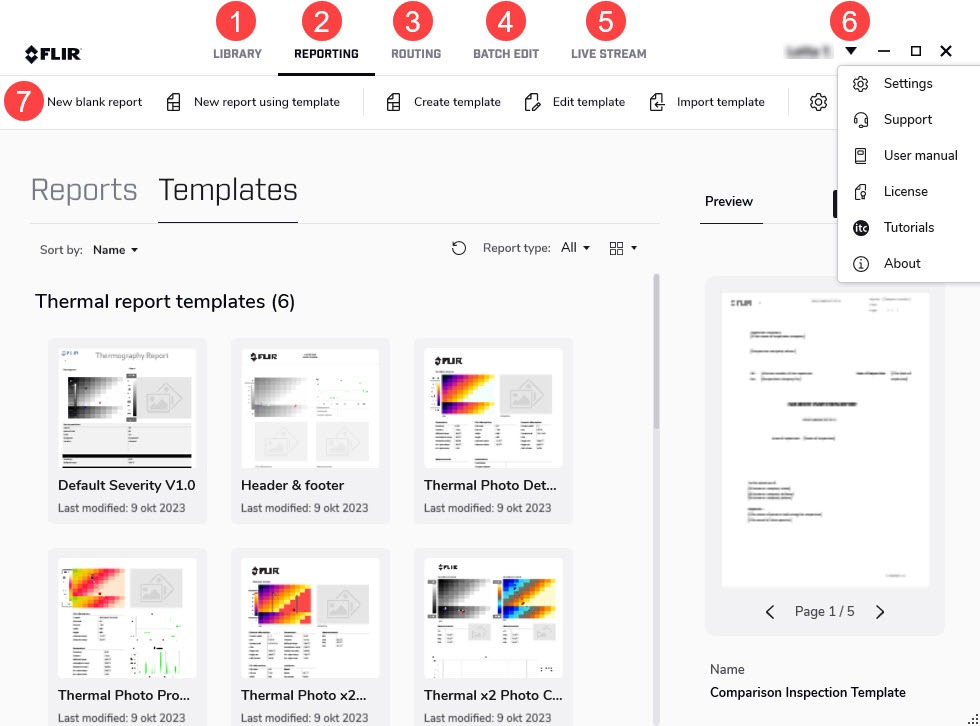
This tab shows the File Explorer of the computer your are working on. Here you can navigate to any folder where you have saved your thermal images, both locally on your computer and on any connected network shares.
When you click a folder, the images in that folder are presented in the center pane. When you click an image in the center pane, information about that image is shown in the pane to the right.
This tab is used to create reports. You can create reports from scratch or by using templates.
This tab is used to create routes and inspection reports.
This tab is used to create and run jobs in batches. Use the batch processing feature for automation of repetitive tasks when editing and normalizing thermal images.
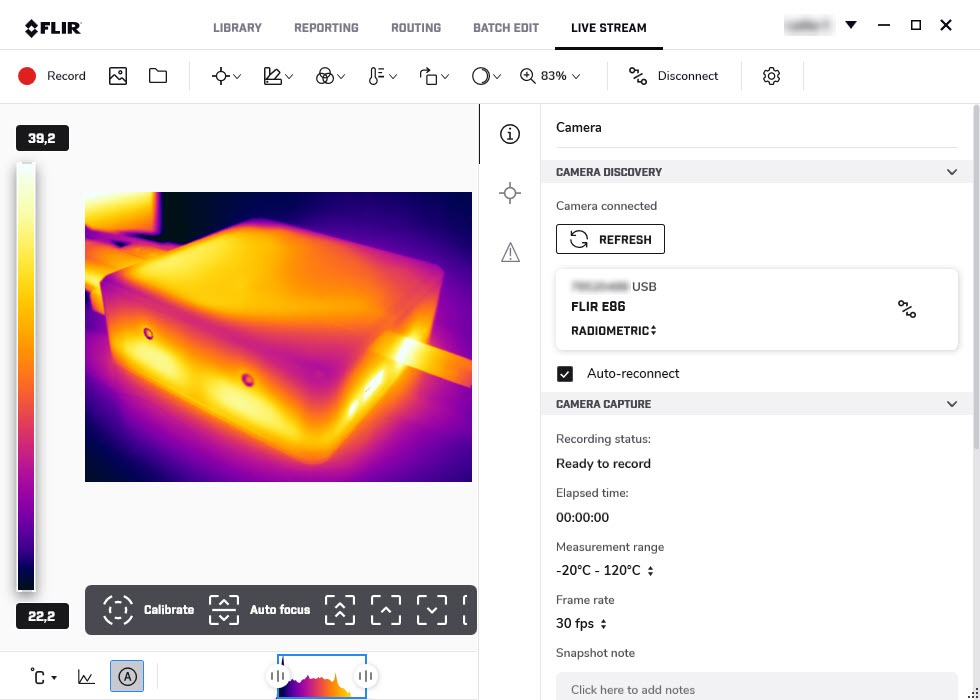
This tab is used to live stream and control USB connected cameras.
Click the arrow to display the drop-down menu.
The toolbar includes functions that are relevant for the selected tab. The toolbar adapts to the window size, meaning that some functions may be available in a group when the window is minimized.
4.2 Settings
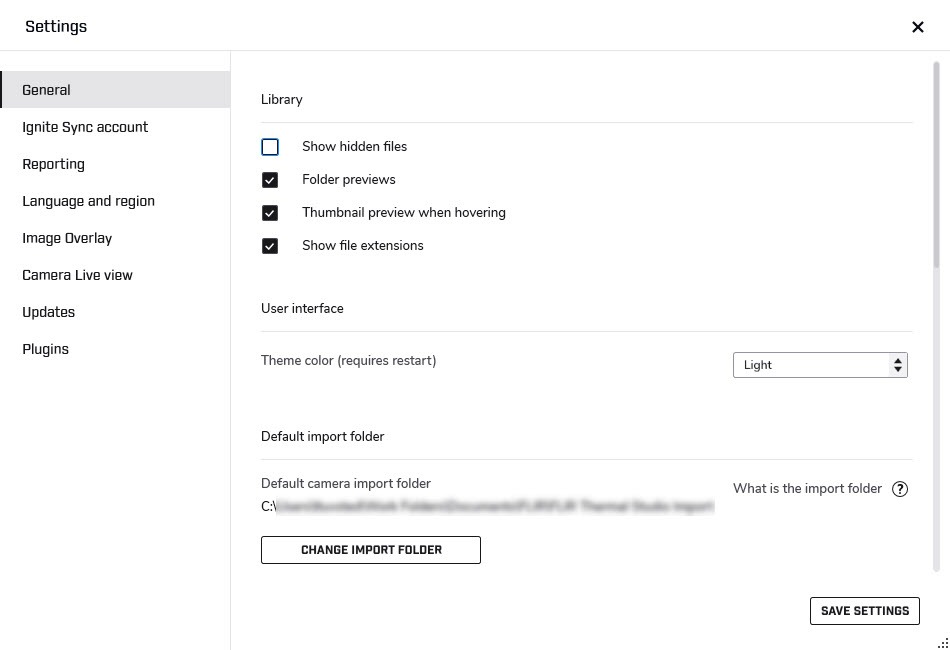
The application settings are configured on the Settings window.
To open the Settings window, do one of the following:
Note Some settings require a restart of the FLIR Thermal Studio application before a change goes into effect.

4.2.1 General
Library
User interface
Default import folder
Palettes
Output
Other
4.2.2 Ignite Sync account
FLIR Ignite is a cloud storage service for thermal images. FLIR Ignite Sync is a PC–based (Windows 10) application that allows you to sync your image library with your computer, for easy access when creating reports.
To install FLIR Ignite Sync, click Install Ignite Sync.
Ignite Sync path displays the path to the sync folder as set up in the FLIR Ignite Sync application.
4.2.3 Reporting
Select the Reporting options and the Default fonts to be used in your reports.
4.2.4 Language and region
Select the language and units to be used in the user interface.
4.2.5 Image Overlay
Select if and how you want to use an image overlay when editing images manually in File Explorer and when running batch processing. When you select or deselect a check box in the list of settings, the result is immediately presented in the example image. Note that the Overlay enabled check box must be selected before the settings can be changed.
4.2.6 Camera Live view
Select options for camera captures and recordings.
4.2.7 Updates
Select how you want to manage updates of the FLIR Thermal Studio application.
With this option enabled, a check for updates will automatically be performed every time the application is started.
With this option enabled, the user will be asked to install any available updates if the Automatically check for updates option is enabled.
Click to manually check if any updates are available for download.
If updates need to be downloaded via a proxy service, configuration is needed. In the Proxy settings dialog box, select the Use proxy check box, and then enter the requested information. Click OK to save.
4.2.8 Plugins
Plug-ins are supported by FLIR Thermal Studio Pro.
Click License to activate a plug-in. For more information, see 3.4 Plug-in activation .
After activation, you can change the settings for the plug-in here.
Note The Routing functionality is included in FLIR Thermal Studio Pro, without license activation.
Image editor
This chapter describes how to use the image editor.
5.1 General
The FLIR Thermal Studio application includes an embedded image editor where you can edit thermal images and sequences (videos).
To open the image editor, do one of the following:
5.2 Navigation

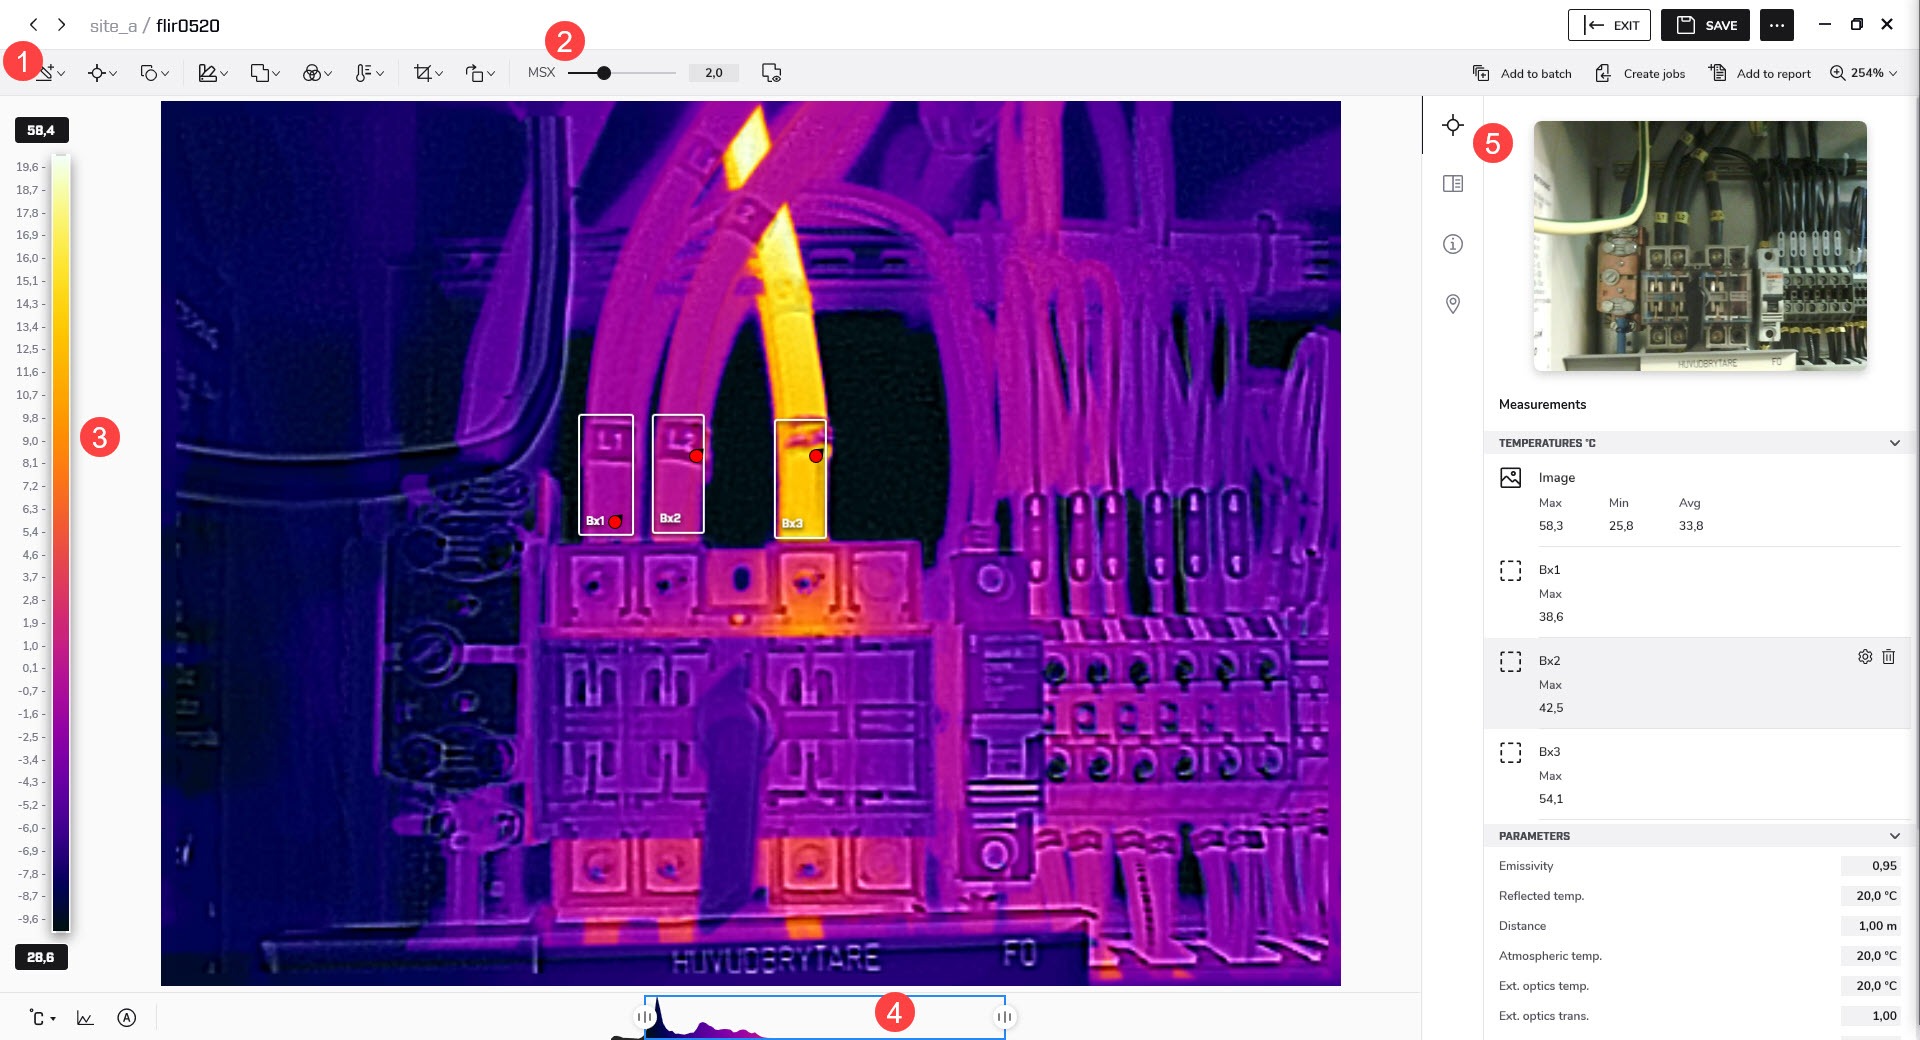
The toolbar includes options such as adding measurements, changing palettes, and controlling isotherms and the color distribution.
Displays the currently selected fusion mode and any additional mode settings.
Use the controls to adjust the temperature scale.
Use the vertical pane toolbar to select display of measurements, notes, camera details, and geolocation.
5.3 Temperature span and levels
At the bottom of the infrared image you have two sliders. By dragging these sliders to the left or to the right, you can change the top and bottom levels of the temperature span. If you change the span to temperatures closer to the temperature of the object you are analyzing, it will be easier to analyze any temperature anomalies.
5.3.1 Auto-adjust control
When you auto-adjust a thermal image, you adjust it for the best image brightness and contrast. This means that the color information is distributed over the existing temperatures of the image.
In some situations the image may contain very hot or very cold areas outside your area of interest. In such cases you might want to exclude those areas and use the color information only for the temperatures in your area of interest. You can do so by defining an auto-adjust region.
To auto-adjust an image, do one of the following:
To define an auto-adjust region, follow this procedure:
5.4 Sketch
You can add an image, e.g. a logo, on top of the image.
5.5 Measurement tool
You can add one or more measurement tools to the image, such as Spotmeter, Rectangle, and Polygon.
Each measurement tool has its own settings, which are available in the Measurements section of the properties pane.
5.5.1 Add a measurement tool
5.5.2 Edit a measurement tool
5.5.3 Change settings of a measurement tool
The tool settings are available in the Measurements section of the properties pane.
To display the tool settings, do one of the following:
5.5.4 Delete a measurement tool
To display the tool settings, do one of the following:
5.5.5 Use the Delta tool
The Delta tool gives the difference (delta) between two measurement results, or between a measurement result and a reference temperature.
5.5.6 Use the Magic wand
Use the Magic wand to capture an area in the image based on pixel temperature. This is similar to the Polygon measurement tool but more advanced and easier to use when you want to capture and measure more complex shapes.
5.5.7 Export to a csv file
Use the Export to csv functionality to export detailed temperature information. The export will include the temperature values of every pixel within the selected measurement tool.
5.5.8 Use coverage
Use the Coverage functionality to see, as a percentage, the number of pixels in an area that are above or below a certain temperature. The area is defined by the outline of a measurement tool, such as a rectangle or ellipse.
The coverage percentage is displayed in the Measurements section of the properties pane. It is also possible to apply a contrasting color to all pixels in the area that meet the temperature setting.
5.6 Shape
You can add shapes to the images, such as arrows, comments, and alerts.
5.6.1 Add a shape
5.7 Palette
You can change the palette that is used to display the temperatures within an image. A different palette can make it easier to analyze the image. The FLIR Thermal Studio application comes with a set of predefined palettes, but custom palettes can also be used.
To change the palette, follow this procedure:
To export a palette, follow this procedure:
5.8 Fusion mode
Use the Fusion mode feature to mix a visual image with its corresponding thermal image. The following fusion modes are available:
Displays a thermal image where the edges of the objects are enhanced. The thermal–visual balance can be adjusted.
Displays a fully thermal image.
Displays a visual image with some parts displayed as a thermal image, depending on the temperature limits.
Displays a blended image that uses a mix of thermal image pixels and visual image pixels. The thermal–visual balance can be adjusted.
Displays a thermal image frame on top of a visual image.
Displays a fully visual image.
To set the fusion mode, follow this procedure:
Note that some of the modes have additional settings:
MSX
Thermal fusion
Blending
Picture in picture
Visual only
5.9 Color distribution
Use the Color distribution option to change the distribution of colors in the image. A different color distribution can make it easier to analyze the image more thoroughly. The following distributions are available:
The color information is distributed over the existing temperatures of the image. This method of distributing the information is especially successful when the image contains few peaks at very high temperature values.
The color information in the image is distributed linearly with respect to the signal values of the pixels.
The color information in the image is distributed linearly with respect to the temperature values of the pixels.
The high-frequency content in the image, such as edges and corners, are enhanced to increase the visibility of details.
To change the color distribution, follow this procedure:
5.10 Isotherms control
Using isotherms is a good method to easily discover anomalies in a thermal image. The isotherm functionality applies a contrasting color to all pixels with a temperature above, below, or within a certain temperature interval. You can also create your own isotherm formulas.
For building inspection, there are specific alarms for detection of humidity, insulation, and condensation issues.
To add an isotherm or alarm, follow this procedure:
5.11 Crop an image
Use the Crop image option to trim the image. Provided that the cropped image has not been saved, it is possible to revert to the original image size.
To crop an image, follow this procedure:
To revert to the uncropped image, follow this procedure:
5.12 Image rotation
To rotate an image, follow this procedure:
As an alternative, type the desired angle in the Angle text box.
5.13 Filter
Filters for enhanced gas visualization are available for video files (.seq and .csq).
Using the high sensitivity mode and pixel binding filters can make it easier to identify gas leaks.
5.14 Show a profile plot
The plot shows the temperature profile along a line or rectangle in the image.
5.15 Show a time-temperature plot
This plot is available for video files (.seq and .csq). The plot shows the temperature fluctuations over time for the image statistics (max, min, average) and for selected measurement tools.
5.16 Video controls
When you open a video file in the image editor, video controls such as play/pause, auto repeat, and save a snapshot are available at the bottom of the window.
To save a part of the video as a separate file, follow this procedure:
5.17 Save changes
To save the changes in the original file, do one of the following:
To save the image with the changes in a new file, click the button with three dots at the top right corner and then click Save as.


